In Fall 2024, 791 doctoral (Ph.D.) research students were enrolled at IU Indianapolis, which is 9.9% of the total IU Indianapolis graduate and professional student body. The following tables break down Ph.D. student data into different categories.
| Sex |
|---|
| | Numbers | Percentage |
|---|
| Female | 491 | 62.1% |
|---|
| Male | 300 | 37.9% |
|---|
| Race & Ethnicity |
|---|
| | Numbers | Percentage |
|---|
| African American | 84 | 10.6% |
|---|
| Asian American | 60 | 7.6% |
|---|
| Hispanic/Latino | 40 | 5.1% |
|---|
| International | 243 | 30.7% |
|---|
| Two or more races | 20 | 2.5% |
|---|
| White | 341 | 43.1% |
|---|
| Other | 3 | <1% |
|---|
| Residency |
|---|
| | Numbers | Percentage |
|---|
| Indiana Resident | 356 | 45% |
|---|
| International | 235 | 29.7% |
|---|
| Non-Resident | 200 | 25.3% |
|---|
MSEP* Recipient
*Midwest Student Exchange Program | 36 | 4.6% |
|---|
|
|
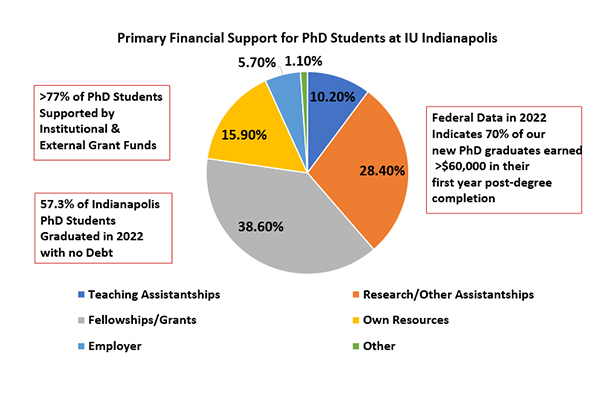
In 2022, 70% of our new PhD graduates earned >$60,000 in their first year post-degree completion.
| Discipline Area | Stipend Range 10-month appointment* | Stipend and
Health | Tuition | 10 or 12 Month
Appointments | Length of
Support |
|---|
| Health Science Medicine | $16,400 - $26,250 | Provided | Amount and credit hour limits vary | Primarily 12 month | 1 - 6 years |
|---|
| Humanities, Social Sciences, Arts | $12,600 - $22,000 | Provided | Amount and credit hour limits vary | Primarily 10 month | 2 - 5 years |
|---|
| STEM | $18,000 - $24,000 | Provided | Amount and credit hour limits vary | Primarily 12 month | 1 - 6 years |
|---|
*Range of student stipends in fall 2021. Academic programs in Indianapolis support a mix of Graduate Fellowships, Research Assistantships, Teaching Assistantships, and Graduate Assistantships to varying degrees. Graduate students with honorary awards, recruitment fellowships, or federal funding typically received stipends at or above those listed.
Average stipend overall for Indianapolis graduate students with academic appointments in 2021-2022 was $19,823 over 10 months with a 50% FTE appointment. That year, the average stipend for Indianapolis graduate students with a teaching assistantship was $23,454, for students with a research assistantship the stipend was $22,408, and for students with a graduate assistantship the average stipend was $17,507
Compare the cost of living between your city and Indianapolis by using this cost of living calculator
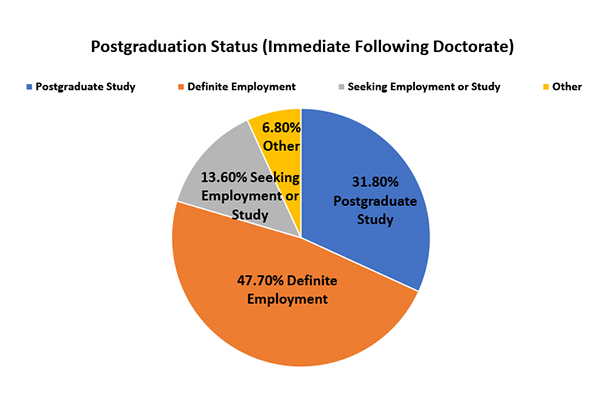
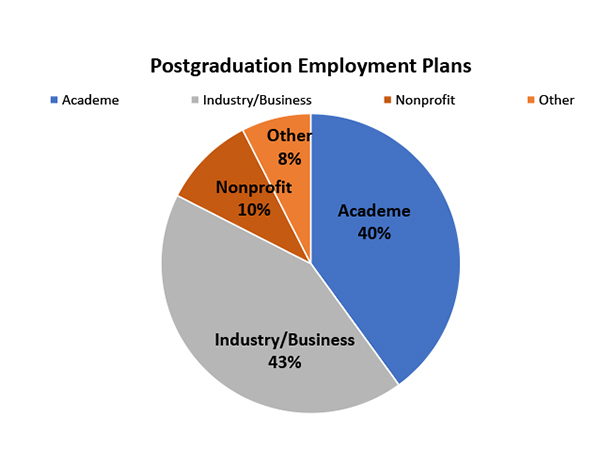
The following data is taken from the 2023 Survey of Earned Doctorates.